| Petición desde HP
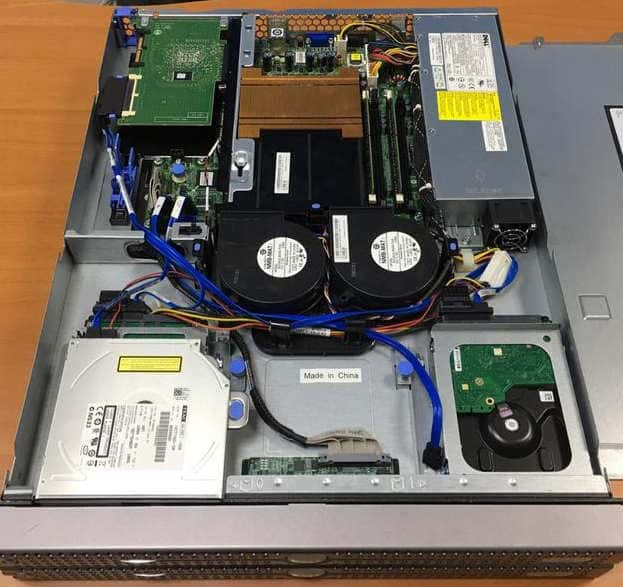
A6_5400 hacia DELL R200 |
Petición desde HP
A6_5400 hacia HP A6_5400
|
Server
Software:
Apache/2.4.25
Server
Hostname:
192.168.1.60
Server
Port:
80
Document
Path:
/
Document
Length: 1112
bytes
Concurrency Level: 5
Time taken for tests: 4.606 seconds
Complete requests:
50000
Failed
requests: 0
Total transferred:
69200000 bytes
HTML
transferred: 55600000
bytes
Requests per second: 10855.19 [#/sec] (mean)
Time per
request: 0.461 [ms]
(mean)
Time per
request: 0.092 [ms]
(mean, across all concurrent requests)
Transfer
rate:
14671.47 [Kbytes/sec] received
Connection Times (ms)
min mean[+/-sd] median max
Connect:
0 0
0.0
0 4
Processing:
0 0
0.1
0 4
Waiting:
0 0
0.1
0 4
Total:
0 0
0.1
0 4
|
Server
Software:
Apache/2.4.25
Server
Hostname:
192.168.1.120
Server
Port:
80
Document
Path:
/
Document
Length: 1215
bytes
Concurrency Level: 5
Time taken for tests: 6.785 seconds
Complete requests:
50000
Failed
requests: 0
Total transferred:
74350000 bytes
HTML
transferred: 60750000
bytes
Requests per second: 7368.79 [#/sec] (mean)
Time per
request: 0.679 [ms]
(mean)
Time per
request: 0.136 [ms]
(mean, across all concurrent requests)
Transfer
rate:
10700.57 [Kbytes/sec] received
Connection Times (ms)
min mean[+/-sd] median max
Connect:
0 0
0.1
0 2
Processing:
0 0
0.3
0 7
Waiting:
0 0
0.2
0 7
Total:
0 1
0.3
1 7
|
Server
Software:
Apache/2.4.25
Server
Hostname:
192.168.1.60
Server
Port:
80
Document
Path:
/myblog2
Document
Length: 314
bytes
Concurrency Level: 5
Time taken for tests: 3.966 seconds
Complete requests:
50000
Failed
requests: 0
Non-2xx responses:
50000
Total transferred:
27100000 bytes
HTML
transferred: 15700000
bytes
Requests per second: 12607.66 [#/sec] (mean)
Time per
request: 0.397 [ms]
(mean)
Time per
request: 0.079 [ms]
(mean, across all concurrent requests)
Transfer
rate:
6673.20 [Kbytes/sec] received
Connection Times (ms)
min mean[+/-sd] median max
Connect:
0 0
0.3
0 33
Processing:
0 0
0.2
0 33
Waiting:
0 0
0.2
0 33
Total:
0 0
0.4
0 33
|
Server
Software:
Apache/2.4.25
Server
Hostname:
192.168.1.120
Server
Port:
80
Document
Path:
/myblog
Document
Length: 315
bytes
Concurrency Level: 5
Time taken for tests: 6.444 seconds
Complete requests:
50000
Failed
requests: 0
Non-2xx responses:
50000
Total transferred:
27150000 bytes
HTML
transferred: 15750000
bytes
Requests per
second: 7759.65 [#/sec] (mean)
Time per
request: 0.644 [ms]
(mean)
Time per
request: 0.129 [ms]
(mean, across all concurrent requests)
Transfer
rate:
4114.74 [Kbytes/sec] received
Connection Times (ms)
min mean[+/-sd] median max
Connect:
0 0
0.1
0 3
Processing:
0 0
0.2
0 10
Waiting:
0 0
0.2
0 9
Total:
0 1
0.2
1 10
|
