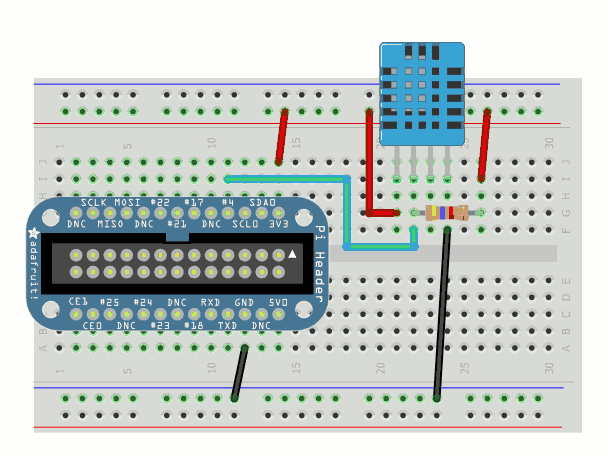
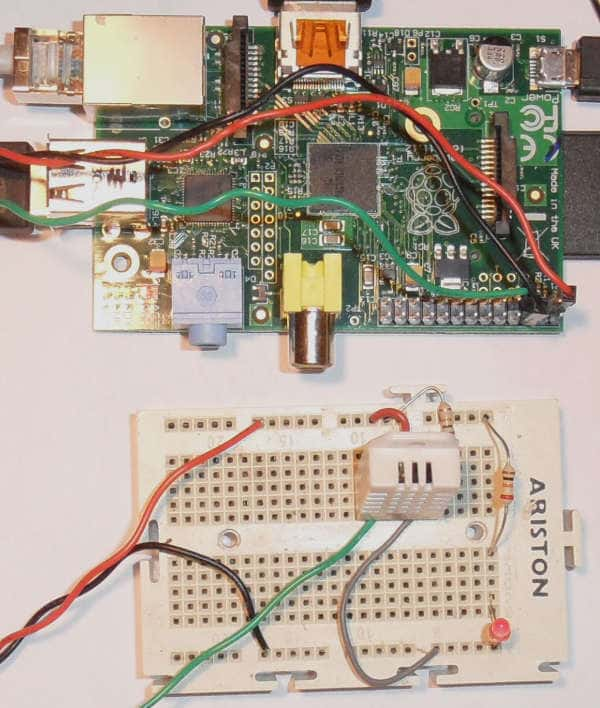
RPi VCC (pin 1) -> DHT11 pin 1
RPi GPIO4 (pin 7) -> DHT11 pin 2
RPi GND (pin 6) -> DHT11 pin 4


| dth11.c |
| //Incluimos
librerias necesarias #include <wiringPi.h> #include <stdio.h> #include <stdlib.h> #include <stdint.h> //Definimos constantes #define MAX_TIME 85 #define DHT11PIN 7 #define ATTEMPTS 5 //Definimos un vector global int dht11_val[5]={0,0,0,0,0}; ///////////////////////////////////////////////////////////// //Funcion principal para leer los valores del sensor. int dht11_read_val(){ uint8_t lststate=HIGH; uint8_t counter=0; uint8_t j=0,i; for(i=0;i<5;i++){ dht11_val[i]=0; } pinMode(DHT11PIN,OUTPUT); digitalWrite(DHT11PIN,LOW); delay(18); digitalWrite(DHT11PIN,HIGH); delayMicroseconds(40); pinMode(DHT11PIN,INPUT); for(i=0;i<MAX_TIME;i++){ counter=0; while(digitalRead(DHT11PIN)==lststate){ counter++; delayMicroseconds(1); if(counter==255){ break; } } lststate=digitalRead(DHT11PIN); if(counter==255){ break; } //Las 3 primeras transiciones son ignoradas if((i>=4)&&(i%2==0)) { dht11_val[j/8]<<=1; if(counter>16) dht11_val[j/8]|=1; j++; } } // Hacemos una suma de comprobacion para ver si el dato es correcto. Si es asi, lo mostramos if((j>=40)&&(dht11_val[4]==((dht11_val[0]+dht11_val[1]+dht11_val[2]+dht11_val[3])& 0xFF))) { //printf("%d.%d,%d.%d\n",dht11_val[0],dht11_val[1],dht11_val[2],dht11_val[3]); //printf("data -> %02x, %02x, %02x, %02x paridad %d\n",dht11_val[0],dht11_val[1],dht11_val[2],dht11_val[3],dht11_val[4]); //printf("Temperatura=%d ºC /10 Humedad=%d /10\n",dht11_val[2]*256+dht11_val[3],dht11_val[0]*256+dht11_val[1]); printf("%d,%d\n",dht11_val[0]*256+dht11_val[1],dht11_val[2]*256+dht11_val[3]); return 1; } else { //printf("Error\n"); return 0; } } //////////////////////////////////////////////////////////////// //Empieza nuestro programa principal. int main(void){ //Establecemos el numero de intentos que vamos a realizar //la constante ATTEMPTS esta definida arriba int attempts=ATTEMPTS; //Si la libreria wiringPi, ve el GPIO no esta listo, salimos de la aplicacion if(wiringPiSetup()==-1){ exit(1); } while(attempts){ //Intentamos leer el valor del gpio, llamando a la funcion int success = dht11_read_val(); //Si leemos con exito, salimos del while, y se acaba el programa if (success){ break; } //Si no lee con exito, restamos 1, al numero de intentos attempts--; //Esperamos medio segundo antes del siguiente intento. delay(500); } return 0; } |
| dth11.sh |
| #!/bin/bash FECHA=$(date +\%Y\%m\%d\%H\%M) COMA="," TEMP=$(/aa/dth11) echo "$FECHA$COMA$TEMP" >> /var/www/tempe.csv |
| Ejemplo de tempe.csv
.Para borrar el registro, quitar todo menos la primera
línea. |
| Date,Humedad,Temperatura 201309241218,62.2,39.4 201309241219,60.2,44.1 201309241220,55,45 201309241221,54,40 201309241222,54,1 201309241223,54,-10 201309241224,54,-15 |
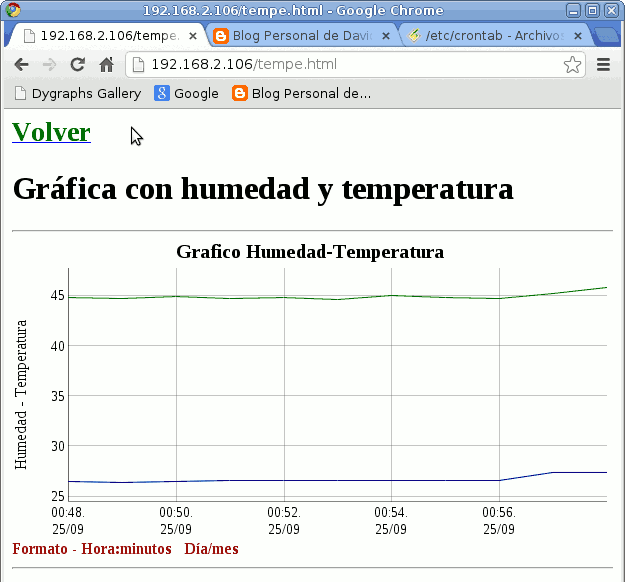
* * * * * /aa/dth11.shEl servidor apache sirve la página tempe.html , en la cual existe un código en javascript que realiza una grafica. Para realizar la gráfica se utiliza la librería dygraph-combined.js en javascript . Para más información recomiendo visitar la página http://dygraphs.com/index.html . Nunca había realizado nada en javascript por lo que me he tenido que poner las pilas y estudiar algún tutorial.
| tempe.html |
| <!DOCTYPE
HTML PUBLIC "-//W3C//DTD HTML 4.01 Transitional//EN"> <html> <head> <meta http-equiv="content-type" content="text/html; charset=ISO-8859-1"> <script type="text/javascript" src="dygraph-combined.js"></script> </head> <body> <h1><a href="index.html"><small><span style="font-weight: bold; color: rgb(0, 102, 0);">Volver</span></small></a></h1> <h1>Gráfica con humedad y temperatura<br> </h1> <big><big><span style="font-weight: bold; color: rgb(0, 102, 0);"></span></big></big> <hr> <div id="normal" style="width:600px; height:300px;"></div> <span style="color: rgb(153, 0, 0); font-weight: bold;">Formato - Hora:minutos Día/mes</span> <hr> <script type="text/javascript"> g4 = new Dygraph( document.getElementById("normal"), "tempe.csv", { title: 'Grafico Humedad-Temperatura', xlabel: ' ', ylabel: 'Humedad - Temperatura', labelsDivWidth: 150, labelsSeparateLines: true, axes: { x: { axisLabelFormatter: function(x) { var anyString=x.toString(); return (anyString.substring(8,10) + ":" + anyString.substring(10,12) + ".\n"+anyString.substring(6,8)+"/"+anyString.substring(4,6) ); }, } }, } ); </script> </body> </html> |
